Online product comparison
The compare tool in ikea.com presented a consistent low visitation despite of the teams effort on improving the tool's MVP.
Lack of positive KPIs among other knowledge gaps might indicated that the problem was wrongly framed.
Starting point
The compare tool in ikea.com presented a consistent low visitation despite of the teams effort on improving the tool's MVP. Lack of positive KPIs among other knowledge gaps might indicated that the problem was wrongly framed.

User needs are not solved just with a "one-fits-all" compare tool
Sift of focus
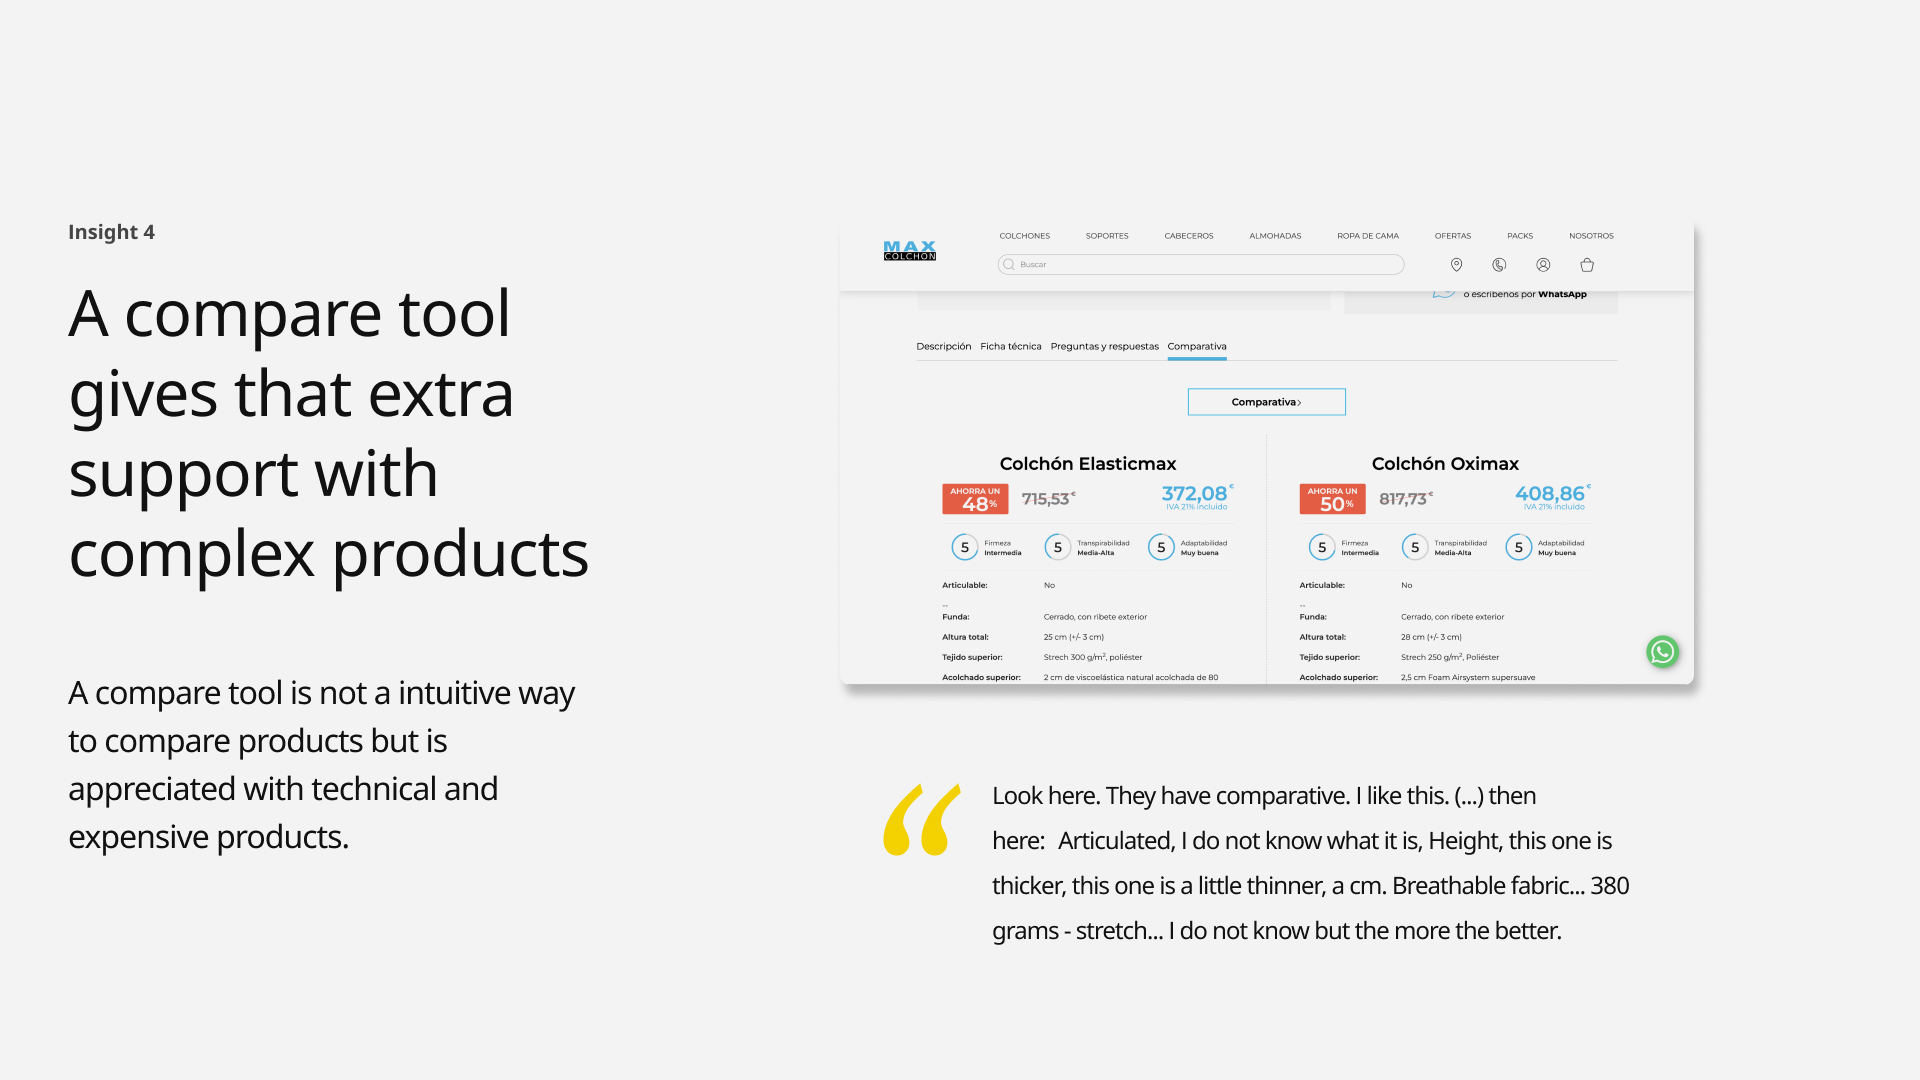
We must present a consistent and improved product information architecture across the journey looking at all the components as an ecosystem of elements that provides the rigth amount of information at the time. The compare tool is one of those elements that helps shoppers with complex product purchases.
"People needs different comparison levels - The depth and time of the comparison process depends of factors like the purchase urgency, previous experiences with the product, product lifecycle (...).
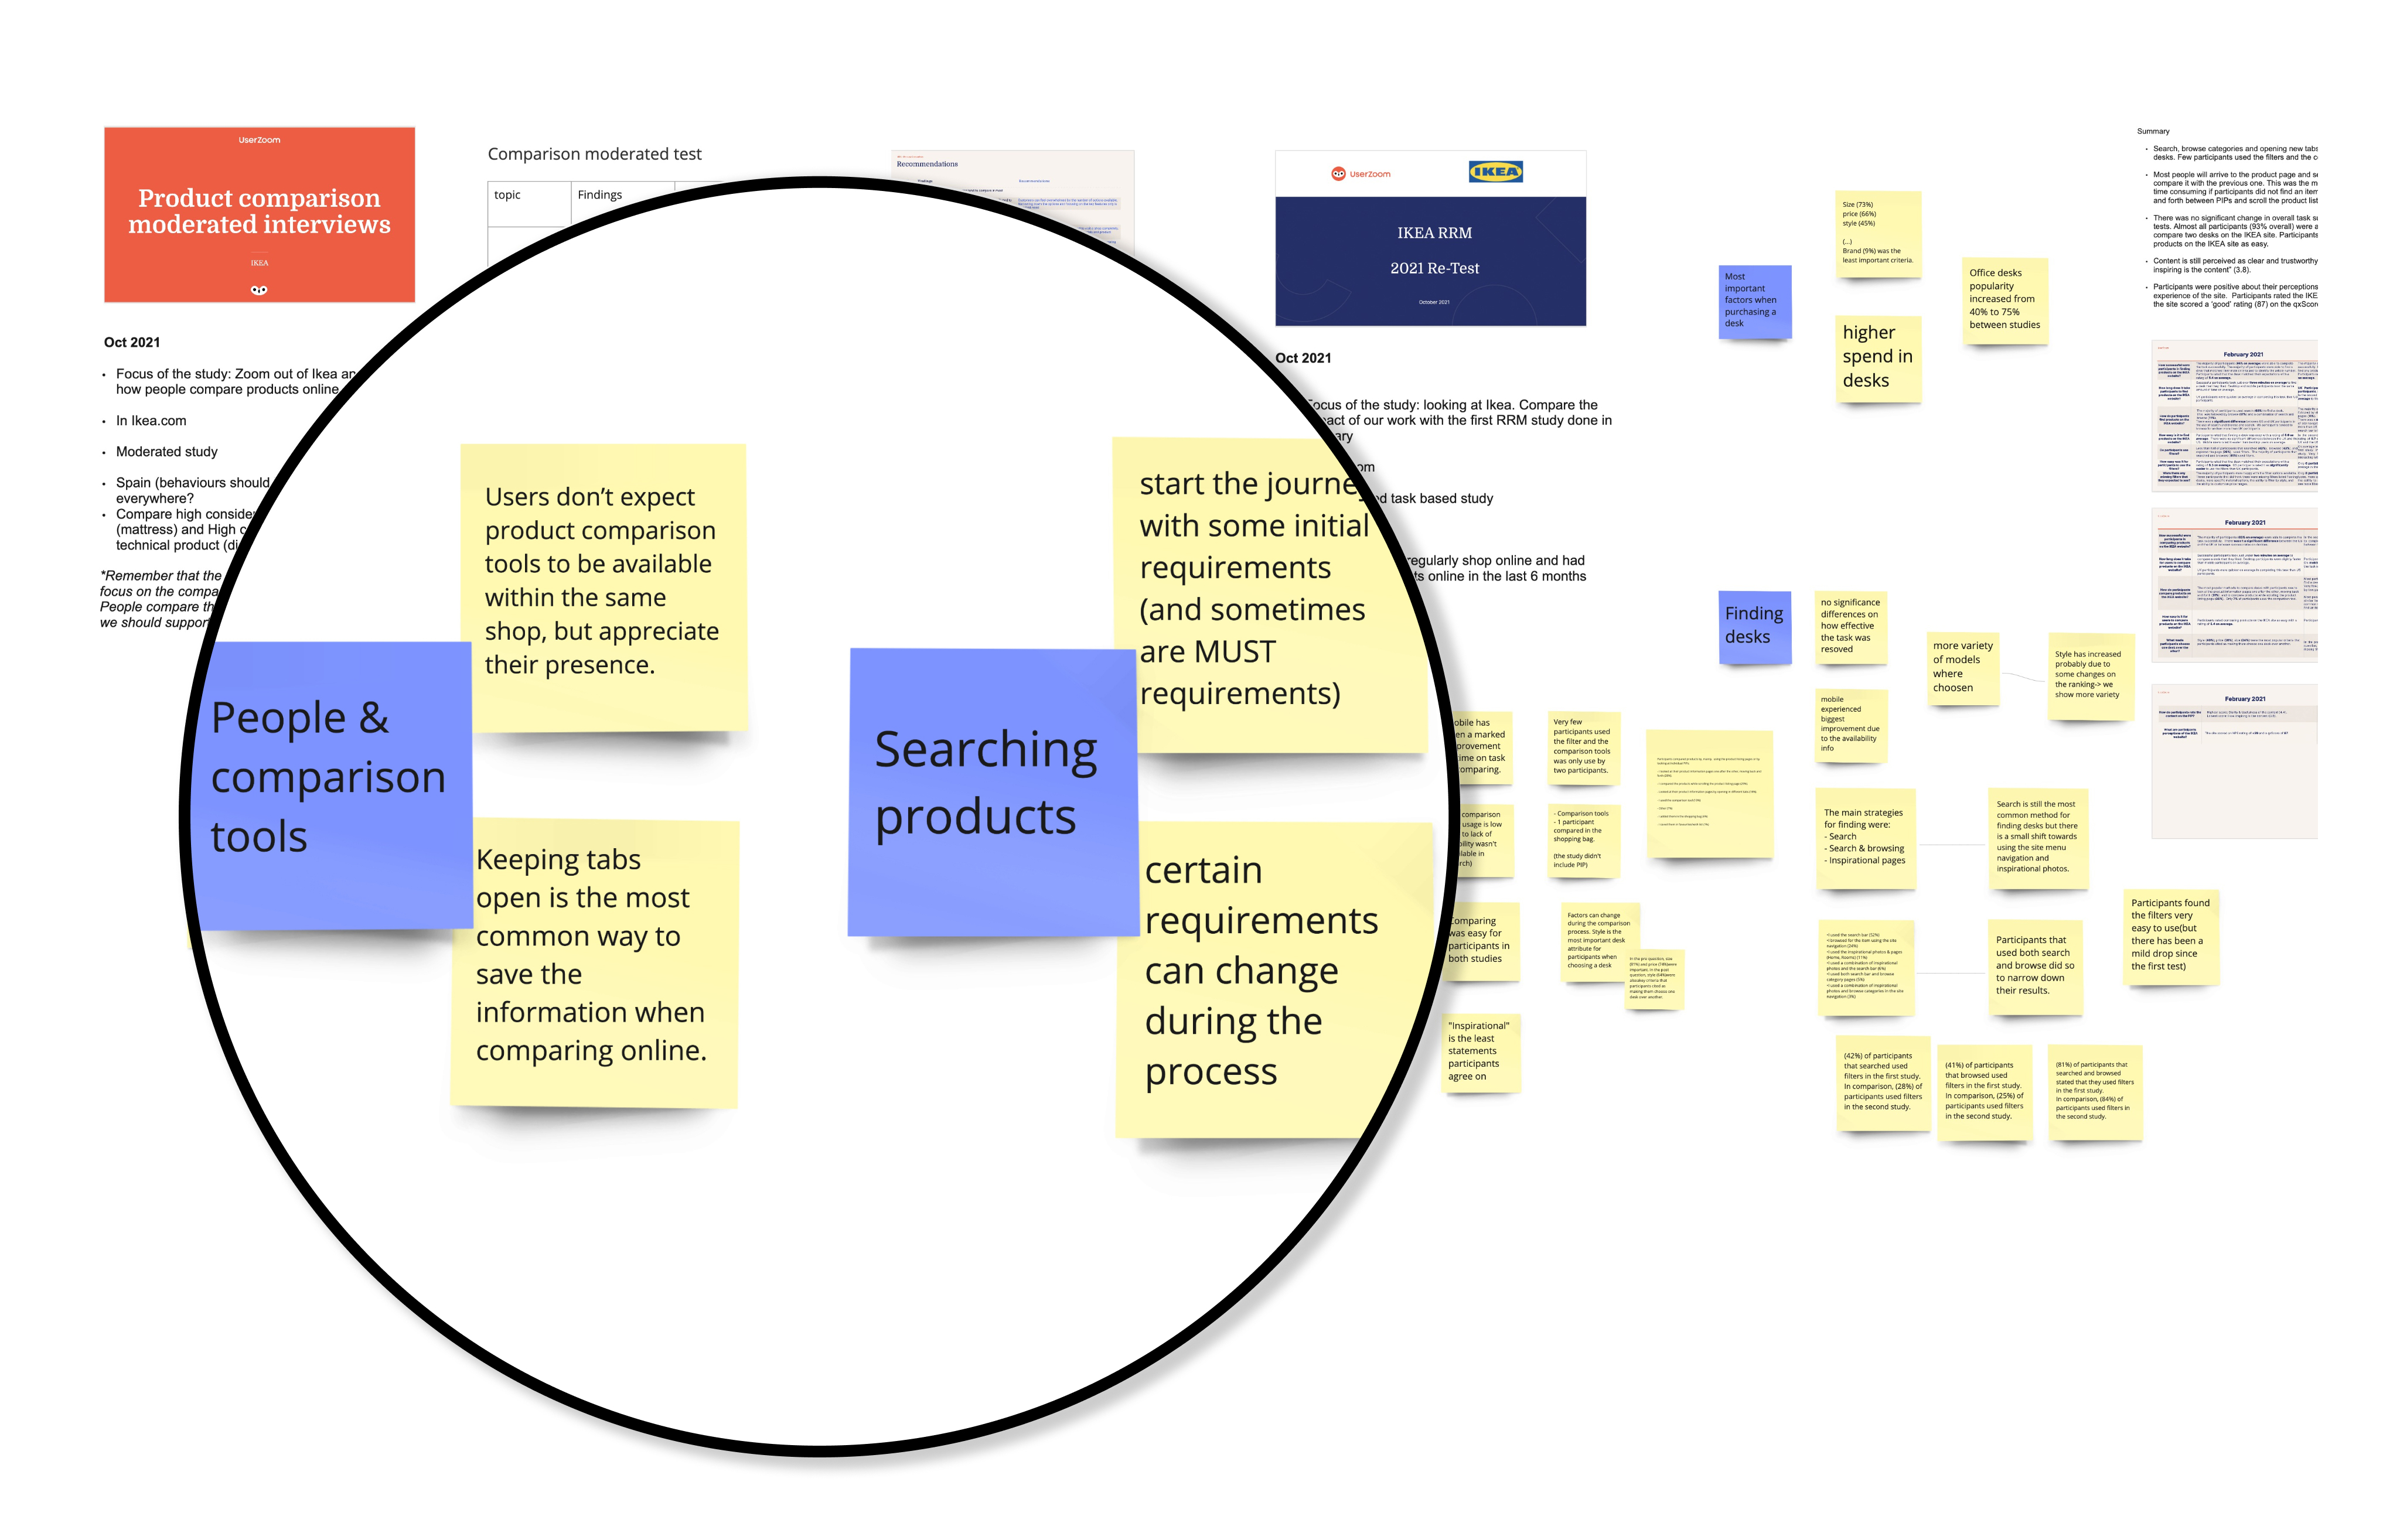
"How people compare online" study with Userzoom
Collaboration with backend
Backend and UX collaborate to define the data structure that will facilitate the new information architecture and ensure consistency through the ecosystem.
Bla bla
Bla bla bla
Test results
in complex purchases.
time to ATC.
in complex purchases.
in complex purchases.
Test results
time to ATC.
in complex purchases.
"It is key to understand compatibility, price difference and quality in the earliest steps of the journey in order to narrow down options.
Qualitative user testings in ikea.com